In the fast-paced world of cryptocurrency trading, analyzing market trends is essential for making informed decisions and maximizing profits. Whether you’re a beginner or an experienced trader, understanding price movements, technical indicators, and fundamental analysis can significantly enhance your ability to navigate the spot market.
Bybit, one of the leading crypto trading platforms in 2025, provides traders with advanced charting tools, real-time data, and sophisticated analytics to assess market trends effectively. This guide will explore the core principles of market trend analysis, including candlestick patterns, technical indicators, and fundamental analysis, helping you develop a well-rounded trading strategy.
Understanding Candlestick Patterns
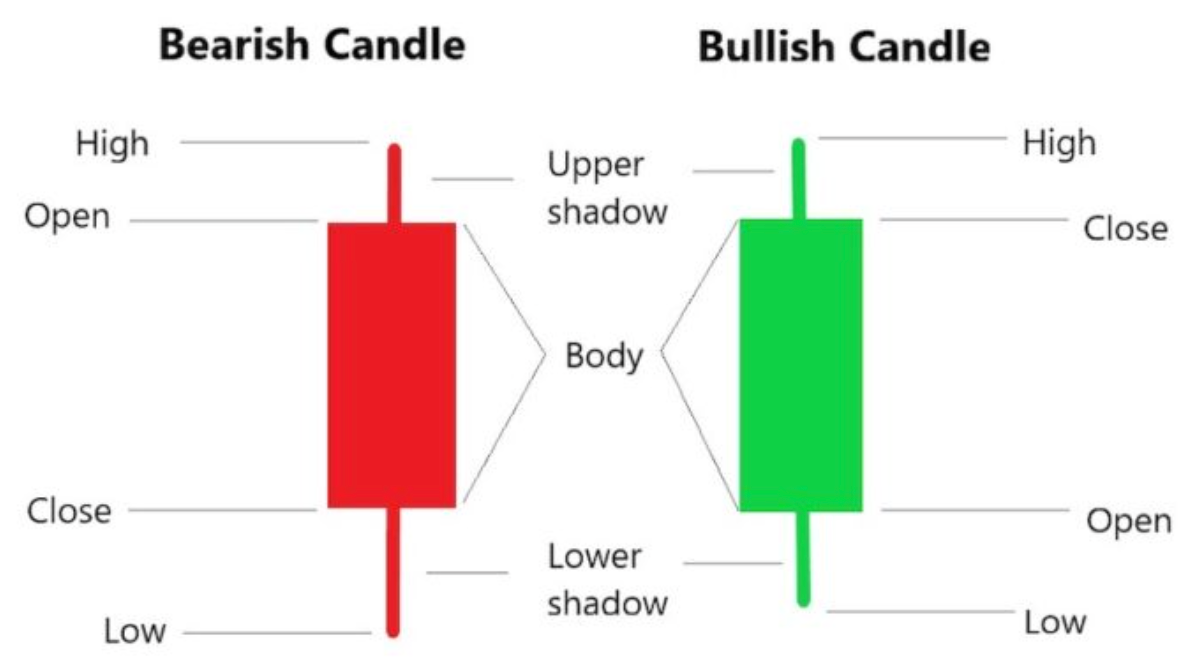
Candlestick patterns are one of the most fundamental tools in technical analysis, providing traders with visual insights into price movements, market sentiment, and potential trend reversals. By studying these patterns, spot traders on Bybit can make more informed trading decisions, identifying key points for entry and exit.
Each candlestick consists of four primary data points:
- Open Price – The price at which an asset starts trading within a specific time frame.
- High Price – The highest price reached during the time frame.
- Low Price – The lowest price reached during the time frame.
- Close Price – The final price of the asset at the end of the time frame.
By analyzing candlestick formations, traders can gauge whether buyers (bulls) or sellers (bears) are in control of the market, allowing them to anticipate future price movements.
Key Candlestick Patterns for Spot Traders
Understanding key candlestick patterns is essential for spot traders to effectively interpret market trends and make informed trading decisions
Bullish Engulfing Pattern: Strong Buy Signal
A bullish engulfing pattern is a powerful reversal pattern that signals the end of a downtrend and the potential beginning of an uptrend. It consists of a small red candle followed by a larger green candle that completely engulfs the previous one. This pattern indicates strong buying momentum as the bulls overpower the bears.
Key Characteristics:
- Occurs at the bottom of a downtrend.
- The green candle must fully engulf the previous red candle.
- Signals a shift in market sentiment from bearish to bullish.
Example: Ethereum (ETH) has been experiencing a downtrend, trading around $2,500. After multiple red candles, a bullish engulfing pattern forms at a key support level. This signals that buyers are stepping in, absorbing selling pressure. Traders enter long positions, expecting ETH’s price to rise towards $2,800.
Confirmation Tip: For stronger confirmation, traders should check additional indicators such as Rthe elative Strength Index (RSI) below 30 (oversold condition) or increasing trading volume, which supports a bullish reversal.
Bearish Engulfing Pattern: Strong Sell Signal
A bearish engulfing pattern is the opposite of a bullish engulfing. It appears at the top of an uptrend and suggests that selling pressure is increasing. This pattern occurs when a large red candle engulfs the previous green candle, signaling a shift from bullish to bearish sentiment.
Key Characteristics:
- Appears at the top of an uptrend.
- The red candle must fully engulf the previous green candle.
- Indicates strong selling pressure and the potential start of a downtrend.
Example: Bitcoin (BTC) has been rallying and reached a peak of $48,000. At this level, a bearish engulfing pattern forms, suggesting that buyers are losing control and sellers are taking over. Traders who recognize this pattern may enter short positions, anticipating BTC’s price to drop to $45,500 or lower.
Confirmation Tip:
For stronger confirmation, traders should look at:
- RSI above 70 (overbought condition).
- MACD bearish crossover (signal line crossing above the MACD line).
Doji Candlestick: Indecisiveness in the Market
A doji candlestick forms when an asset’s opening and closing prices are nearly identical, creating a cross or plus-shaped candle. This pattern signifies indecision in the market, where neither buyers nor sellers have a clear advantage.
Key Characteristics:
- Small or non-existent body.
- Long wicks on both ends indicate price fluctuation.
- Signals potential reversals when appearing after strong trends.
Example:
Solana (SOL) is trading near $90, testing a major resistance level. A doji candlestick forms, indicating uncertainty among traders. This signals that the current trend may lose momentum. Traders wait for confirmation—if the next candle is bearish, they might short SOL, expecting a decline.
Confirmation Tip:
- If a bullish doji appears after a downtrend, it signals a potential reversal.
- If a bearish doji appears after an uptrend, it suggests trend exhaustion.
- Check Bollinger Bands—if SOL is at the upper band, a reversal is likely.

Morning Star and Evening Star: Powerful Reversal Signals
The Morning Star and Evening Star are three-candle patterns that indicate potential trend reversals.
Morning Star (Bullish Reversal):
A Morning Star appears at the bottom of a downtrend and consists of:
- A large red candle (showing bearish control).
- A small-bodied candle (indicating market indecision).
- A large green candle (confirming a bullish reversal).
Example:
Ripple (XRP) has been declining, reaching $0.75. A Morning Star forms at a major support level. This signals that selling pressure is weakening and buyers are stepping in. Traders enter long positions, anticipating XRP to climb to $0.90.
Confirmation Tip:
- Increasing trading volume on the third candle.
- RSI moving from oversold to neutral (>30).
Evening Star (Bearish Reversal):
- An Evening Star forms at the top of an uptrend and consists of:
- A large green candle (showing bullish control).
- A small-bodied candle (indicating indecision).
- A large red candle (confirming a bearish reversal).
Example:
Polygon (MATIC) surges from $1.10 to $1.50. At resistance, an Evening Star forms, signaling potential selling pressure. Traders take short positions, expecting MATIC to drop to $1.30.
Confirmation Tip:
- MACD bearish divergence (lower highs on MACD while price makes higher highs).
- Volume increase on the red candle, confirming the downtrend.
Using Technical Indicators: Enhancing Market Trend Analysis
Technical indicators are essential tools that help traders confirm trends, measure momentum, and identify trading opportunities.
Moving Averages (MA): Identifying Trend Direction
Moving averages smooth out price data to identify trends over a given period.
- Simple Moving Average (SMA): A basic average of past closing prices.
- Exponential Moving Average (EMA): Places more weight on recent prices, making it more responsive to changes.
Example: BTC’s 50-day EMA crosses above the 200-day EMA (a golden cross), signaling a strong uptrend. Traders buy BTC, expecting further price increases.
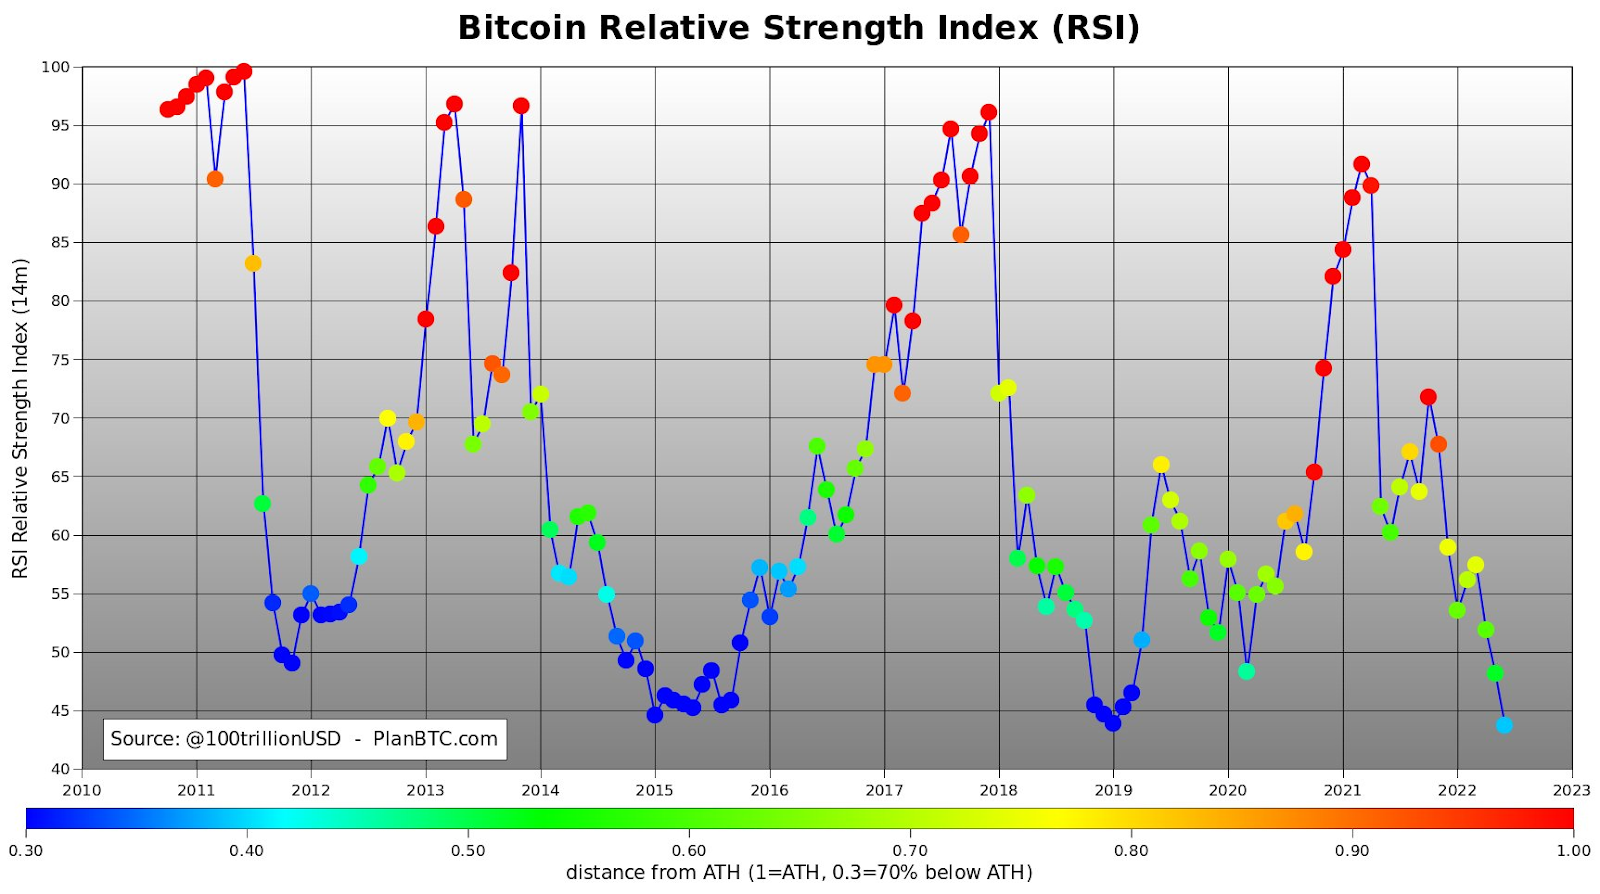
Relative Strength Index (RSI): Measuring Overbought and Oversold Conditions
RSI is a momentum indicator that measures the speed and change of price movements on a scale from 0 to 100.
- Above 70: Overbought conditions, indicating a potential sell-off.
- Below 30: Oversold conditions, suggesting a buying opportunity.
Example: BNB reaches an RSI of 75, signaling an overbought condition. Traders anticipate a correction and take profits.
Bollinger Bands: Detecting Volatility
Bollinger Bands consist of a middle-moving average and two standard deviation bands. When the bands widen, volatility increases; when they narrow, volatility decreases.
Example: SOL’s price touches the upper Bollinger Band, signaling potential resistance. Traders wait for confirmation before shorting.
MACD (Moving Average Convergence Divergence): Identifying Trend Changes
MACD consists of two moving averages and a histogram that shows the difference between them. When the MACD line crosses above the signal line, it indicates a buy signal. A cross below signals a sale.
Example: AVAX’s MACD histogram turns positive, signaling bullish momentum. Traders buy in anticipation of further gains.
Fibonacci Retracement: Finding Support and Resistance Levels
Fibonacci retracement levels help identify potential areas where the price might reverse. The key levels (23.6%, 38.2%, 50%, 61.8%) act as strong support and resistance points.
Example: ETH rises from $2,500 to $3,200, then retraces to $2,850 (50% Fibonacci level). Traders enter a long position, expecting the uptrend to continue.
Fundamental Analysis for Spot Trading: Evaluating Market Strength
While technical analysis focuses on price action, fundamental analysis assesses the underlying factors that influence a cryptocurrency’s value.
Market News and Events
Major news events, such as regulatory changes, economic reports, or technological advancements, can significantly impact market trends.
Example: A major partnership announcement for Cardano (ADA) boosts investor confidence, leading to a price surge from $1.20 to $1.50.
Supply and Demand Dynamics
The price of a cryptocurrency is heavily influenced by its supply and demand.
Example: Bitcoin’s halving event in 2024 reduces the block reward from 6.25 BTC to 3.125 BTC, decreasing supply. As demand remains high, BTC’s price will rise in 2025.
On-Chain Metrics
On-chain analysis examines blockchain data, such as transaction volume, active addresses, and whale activity.
Example: An increase in ETH staking deposits on Ethereum 2.0 signals strong demand, contributing to price appreciation.
Tokenomics and Project Development
The fundamentals of a crypto project, including token utility, governance mechanisms, and team reputation, play a crucial role in long-term price trends.
Example: A DeFi protocol launching a token-burning mechanism to reduce supply increases scarcity, potentially driving up the price.
Institutional Involvement
Institutional investors, such as hedge funds and corporations, can influence market trends through large-scale purchases.
Example: A major investment firm announces a $500 million BTC purchase, triggering a bullish trend across the crypto market.

Combining Technical and Fundamental Analysis for Optimal Trading Decisions
Successful traders combine both technical and fundamental analysis to make well-informed trading decisions. Bybit’s advanced analytics tools allow traders to integrate multiple data points to validate trends and confirm trade setups.
Example of a Combined Approach in 2025
- Technical Analysis: XRP is trading at $1.10, approaching the 50% Fibonacci retracement level. RSI is at 35, indicating an oversold condition.
- Fundamental Analysis: A positive update on Ripple’s legal case against the SEC strengthens investor confidence.
- Trading Decision: The trader enters a long position at $1.10, targeting $1.40 based on technical support and bullish fundamentals.
Maximize Your Trading Potential on Bybit in 2025
In 2025, mastering market trends is more crucial than ever for spot traders, and Bybit is your ideal trading partner. With its cutting-edge platform, Bybit offers a variety of tools designed to help traders analyze market movements effectively. The real-time charts, customizable indicators, and intuitive user interface make it easy to track trends and identify profitable entry and exit points.
Whether you’re trading crypto or other assets, Bybit ensures seamless execution with low fees and high liquidity. The platform also provides advanced order types, such as limit and market orders, allowing traders to manage risks and maximize profits. With educational resources, demo accounts, and community support, Bybit is committed to empowering traders at all levels. Enhance your market trend analysis and take control of your trades on Bybit — the smart choice for traders in 2025.