Margin trading has revolutionized the way traders engage with financial markets, allowing them to amplify their buying power and potentially maximize returns. However, the increased leverage also brings heightened risks, making it essential for traders to adopt advanced techniques to stay profitable in the long run. Mastering margin trading requires a deep understanding of technical analysis, effective use of trading indicators, and strong psychological discipline.
In this comprehensive guide, we will explore advanced trading techniques for margin trading in 2025. We will delve into the power of technical analysis, how to use indicators effectively, and the critical role of trading psychology and discipline in achieving consistent profitability.
Technical Analysis for Margin Trading
Technical analysis (TA) is the cornerstone of margin trading. It involves studying historical price data, chart patterns, and statistical trends to predict future price movements. Unlike fundamental analysis, which focuses on the intrinsic value of an asset, technical analysis is purely price-driven.

Technical Analysis for Margin Trading: A Deep Dive
Technical analysis (TA) is one of the most powerful tools for margin traders, helping them make informed decisions based on past price movements, volume, and market trends. Unlike fundamental analysis, which evaluates an asset’s intrinsic value by examining economic and financial factors, technical analysis is entirely price-driven. Traders rely on TA to forecast future price movements and determine the best entry and exit points—an essential skill in margin trading, where leverage increases both profit potential and risk exposure.
By using historical price data, chart patterns, trend analysis, and key trading indicators, traders can gain an edge in the highly volatile cryptocurrency market. This section will explore why technical analysis is crucial for margin trading, the fundamental concepts traders need to understand, and how to effectively use these tools for better trading decisions.
Why Technical Analysis Matters in Margin Trading
Margin trading amplifies both profits and losses, making precise trade execution critical. Unlike spot trading, where a trader simply buys and sells assets at full value, margin trading involves borrowing funds to open larger positions. This leverage can magnify gains but also exposes traders to rapid losses if the market moves against them.
How Technical Analysis Helps in Margin Trading:
- Improves trade timing: Helps traders determine optimal entry and exit points.
- Reduces emotional decision-making: Provides data-driven signals rather than relying on intuition.
- Identifies market trends: Helps traders align their positions with prevailing market movements.
- Enhances risk management: Supports the placement of stop-loss and take-profit orders to control downside risk.
For margin traders, technical analysis is a necessity, not a luxury. Using support and resistance levels, trend analysis, and candlestick patterns, traders can anticipate market movements and minimize exposure to unnecessary risks.
Key Technical Analysis Concepts for Margin Trading
Support and Resistance Levels
Support and resistance levels are critical in technical analysis. They represent price levels where buying or selling pressure is strong enough to halt price movement. Understanding these levels helps traders predict where the price may reverse or consolidate.
- Support Level: A price point where demand is strong enough to prevent further decline. It acts as a floor that the price struggles to break below.
- Resistance Level: A price point where selling pressure prevents further upward movement. It acts as a ceiling that the price struggles to break above.
How to Use Support and Resistance in Margin Trading:
- Entering Trades: Traders often open long positions when the price is near a support level and short positions when it is near resistance.
- Setting Stop-Loss Orders: Placing stop-losses just below support (for long trades) or above resistance (for short trades) helps limit risk.
- Breakout Trading: If the price breaks through support or resistance, it may indicate a strong continuation in that direction. Traders use these breakouts for high-probability setups.
Example: If Bitcoin’s price repeatedly bounces off $40,000, that level acts as strong support. If it consistently struggles to break above $42,000, that becomes a strong resistance zone.
Trend Analysis
Trend analysis is one of the most essential margin trading techniques, as traders can maximize gains by following the prevailing trend rather than going against it.
Types of Market Trends:
- Uptrend (Bullish): Prices form higher highs and higher lows, indicating buying pressure.
- Downtrend (Bearish): Prices form lower highs and lower lows, indicating selling pressure.
- Sideways Trend (Consolidation): Prices move within a range, showing market indecision.
Tools for Identifying Trends:
- Trendlines: Straight lines connecting highs (in a downtrend) or lows (in an uptrend) help traders visually confirm trends.
- Moving Averages: The 50-day and 200-day moving averages are commonly used to confirm trends. A price above the moving average suggests an uptrend, while a price below the moving average signals a downtrend.
How Trend Analysis Helps Margin Traders:
- Trade with the trend: Going long in an uptrend or short in a downtrend increases the probability of success.
- Avoid counter-trend trading: Fighting against strong trends often leads to unnecessary losses.
- Use trend-based stop-loss levels: Adjust stop-loss orders based on trend direction to prevent premature exits.

Chart Patterns for Predicting Market Movements
Chart patterns are visual representations of market psychology. Traders analyze these patterns to predict whether a trend will continue or reverse.
Common Chart Patterns Used in Margin Trading:
- Continuation Patterns: Indicate the trend is likely to continue.
- Flags and Pennants: Form after strong price moves and signal continuation.
- Ascending & Descending Triangles: Suggest bullish or bearish breakouts.
Reversal Patterns: Indicate potential trend changes.
- Head and Shoulders: A bearish reversal pattern showing a peak (head) between two lower peaks (shoulders).
- Double Tops & Double Bottoms: Signal the end of an uptrend or downtrend.
Example: A trader identifies a bullish flag pattern in an uptrend and opens a long-margin trade, expecting a breakout. If the breakout occurs, the trade becomes highly profitable.
Candlestick Patterns and Market Sentiment
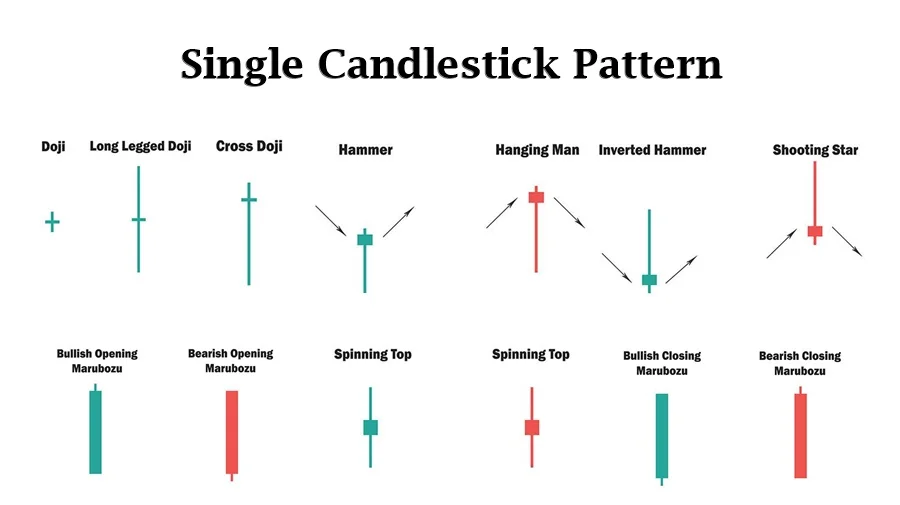
Candlestick patterns provide quick insights into market psychology. They show how price action unfolds within a specific timeframe.
Bullish Patterns:
- Hammer: A small body with a long lower wick signals a potential reversal upwards.
- Bullish Engulfing: A large bullish candle completely engulfs the previous bearish candle, indicating strong buying pressure.
Bearish Patterns:
- Shooting Star: A small body with a long upper wick, suggesting a potential downtrend reversal.
- Bearish Engulfing: A large bearish candle engulfs the previous bullish candle, signaling strong selling pressure.
Using Candlestick Patterns in Margin Trading:
- Traders use these formations to time entries and exits accurately.
- Combining candlestick analysis with support and resistance levels increases trade success probability.
Example: A trader sees a bullish engulfing pattern at a strong support level. This could indicate an excellent entry point for a long-margin trade.

Using Indicators Effectively
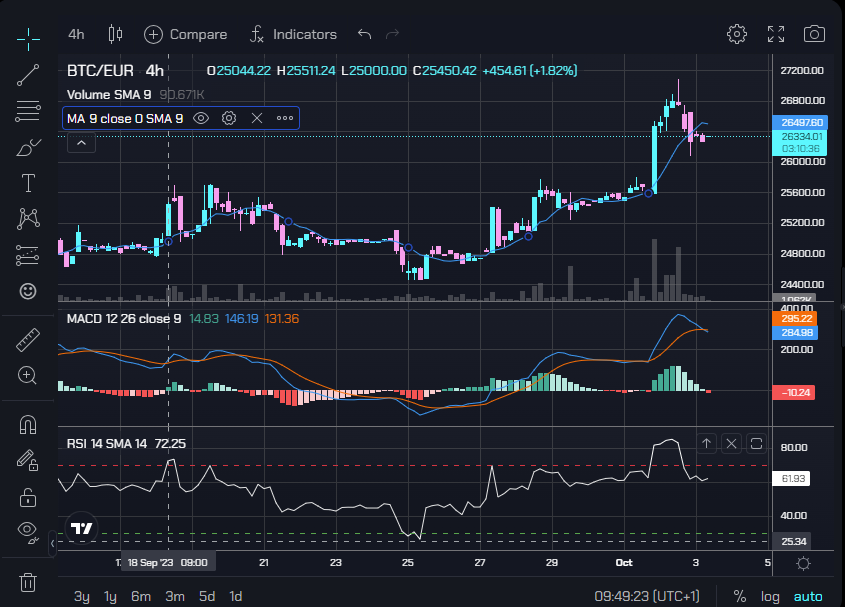
Trading indicators are powerful tools that enhance technical analysis by providing objective, data-driven signals. However, using too many indicators can lead to confusion and “analysis paralysis.” The key is to use a combination of indicators that complement each other.
Essential Trading Indicators for Margin Trading
Moving Averages (MA)
- Moving averages smooth out price data to identify trends.
- The Simple Moving Average (SMA) calculates the average closing price over a set period.
- The Exponential Moving Average (EMA) gives more weight to recent prices, making it more responsive.
- A common strategy is the Golden Cross (bullish signal) and Death Cross (bearish signal), which occur when a short-term MA crosses a long-term MA.
Relative Strength Index (RSI)
- RSI measures the momentum of an asset.
- It ranges from 0 to 100, with above 70 indicating overbought conditions and below 30 indicating oversold conditions.
- Traders use RSI to spot potential reversals and confirm trade entries.
Moving Average Convergence Divergence (MACD)
- MACD helps traders identify trend reversals and momentum shifts.
- A bullish signal occurs when the MACD line crosses above the signal line.
- A bearish signal occurs when the MACD line crosses below the signal line.
- Histogram bars indicate the strength of the momentum.

Bollinger Bands
- Bollinger Bands measure volatility by plotting standard deviations from a moving average.
- When the price touches the upper band, the asset may be overbought.
- When the price touches the lower band, the asset may be oversold.
- Bollinger Bands helps traders identify breakout opportunities.
Fibonacci Retracement
- The Fibonacci tool helps traders identify key retracement levels.
- Common Fibonacci levels are 38.2%, 50%, and 61.8%.
- Traders use these levels to find potential entry and exit points in trending markets.
How to Combine Indicators Effectively
Using multiple indicators together can provide stronger confirmation signals:
Trend Confirmation: Combine Moving Averages with MACD to validate trends.
Overbought/Oversold Conditions: Use RSI along with Bollinger Bands to confirm potential reversals.
Breakout Confirmation: Combine Fibonacci retracement with support and resistance levels for better trade execution.
Trading Psychology and Discipline
Even the best trading strategies can fail if a trader lacks the right mindset. The ability to manage emotions, maintain discipline, and stick to a well-defined trading plan is critical in margin trading.
The Psychological Challenges of Margin Trading
Margin trading introduces higher stakes, which can lead to emotional trading:
Fear and Anxiety
- Traders often exit winning trades too early due to fear of losses.
- Fear of missing out (FOMO) can cause traders to enter positions impulsively.
- To combat fear, traders must trust their strategy and risk management rules.

Greed and Overconfidence
- The temptation to over-leverage can lead to large losses.
- Winning streaks can create overconfidence, causing traders to take unnecessary risks.
- Sticking to a risk-reward ratio prevents greed-driven mistakes.
Revenge Trading
- Losing a trade can trigger a trader to make irrational decisions to recover losses.
- This leads to overtrading and increased risk exposure.
- Accepting losses as part of trading helps maintain discipline.
Building a Disciplined Trading Routine
Develop a Trading Plan
- Set clear rules for entry, exit, and risk management.
- Use stop-loss and take-profit orders to protect capital.
- Maintain a risk-to-reward ratio of at least 1:2 or 1:3.
Keep a Trading Journal
- Document every trade, including entry/exit points and reasons for the trade.
- Analyze mistakes and successes to improve decision-making.
Practice Risk Management
- Limit risk per trade to 1-2% of total capital.
- Avoid over-leveraging—stick to manageable leverage levels.
- Diversify trades to minimize exposure to one asset.
Take Breaks and Manage Stress
- Overtrading leads to fatigue and poor decision-making.
- Taking breaks and maintaining a healthy work-life balance improves focus.
Conclusion
Advanced trading techniques are essential for success in margin trading. By mastering technical analysis, traders can make informed decisions based on price action and trends. Using indicators effectively provides deeper insights into market conditions, helping traders refine their strategies. However, the most critical factor in margin trading success is trading psychology and discipline—staying calm, avoiding emotional decisions, and maintaining a structured approach.
As margin trading continues to evolve in 2025, traders who prioritize strategy, risk management, and discipline will have a significant edge in the highly volatile crypto markets. By implementing these advanced techniques, you can improve your profitability, minimize risk, and enhance your overall trading experience.
Are you ready to take your margin trading to the next level? Apply these strategies today and trade smarter!


