Market analysis is an essential part of any trading strategy, particularly in derivatives markets where volatility and price fluctuations can happen rapidly. Traders rely on different forms of analysis to guide their decisions, whether they are speculating on price movements or looking for opportunities to hedge positions. Bybit, as a leading derivatives trading platform, empowers traders with a range of tools and resources to perform in-depth analysis. In this article, we’ll explore the various components of market analysis, including the importance of technical analysis tools, the role of fundamental analysis, and how to use market sentiment indicators effectively in trading on Bybit.
Technical Analysis Tools
Technical analysis is a method of evaluating and predicting future price movements based on historical price data. It relies on various tools and indicators that track price patterns, volume, momentum, and market trends. Bybit’s platform provides traders with a suite of technical analysis tools to assist in these efforts.
Candlestick Patterns
Candlestick charts are one of the most commonly used tools in technical analysis. Bybit’s charting platform allows traders to view a variety of candlestick formations, which provide insight into the market’s current behavior. Each candlestick represents a fixed period (e.g., 5 minutes, 1 hour, 1 day) and shows the opening, closing, high, and low price during that period.
Certain candlestick patterns, such as Doji, Engulfing, and Hammer, can signal potential reversals or trend continuations. For example, a bullish engulfing pattern suggests that the market may be shifting to a bullish trend, while a bearish engulfing pattern may indicate a potential downtrend. Identifying these patterns can help traders decide when to enter or exit trades, as well as when to adjust their positions.
Moving Averages
Moving averages (MAs) are fundamental indicators used to smooth price data over a specific period, helping traders identify trends and reversals. On Bybit, traders can use different types of moving averages, such as Simple Moving Averages (SMA) or Exponential Moving Averages (EMA), to track price trends over time.
The 50-period SMA is a popular choice for short-term traders, while the 200-period SMA is often used to identify long-term trends. When the short-term moving average crosses above the long-term moving average, it can signal a bullish trend, and vice versa for bearish trends. This cross-over strategy is a staple in many traders’ strategies for identifying potential entry and exit points.
Relative Strength Index (RSI)
The Relative Strength Index (RSI) is a momentum oscillator that measures the speed and change of price movements. It is typically used to identify overbought or oversold conditions in an asset. RSI values range from 0 to 100, with values above 70 indicating that an asset may be overbought and values below 30 suggesting it may be oversold.
On Bybit, traders can use the RSI to identify potential reversal points. If the RSI indicates an overbought condition (above 70), the market may be due for a correction. Conversely, an oversold condition (below 30) can indicate a potential buying opportunity as the market may be due for a bounce.
Bollinger Bands
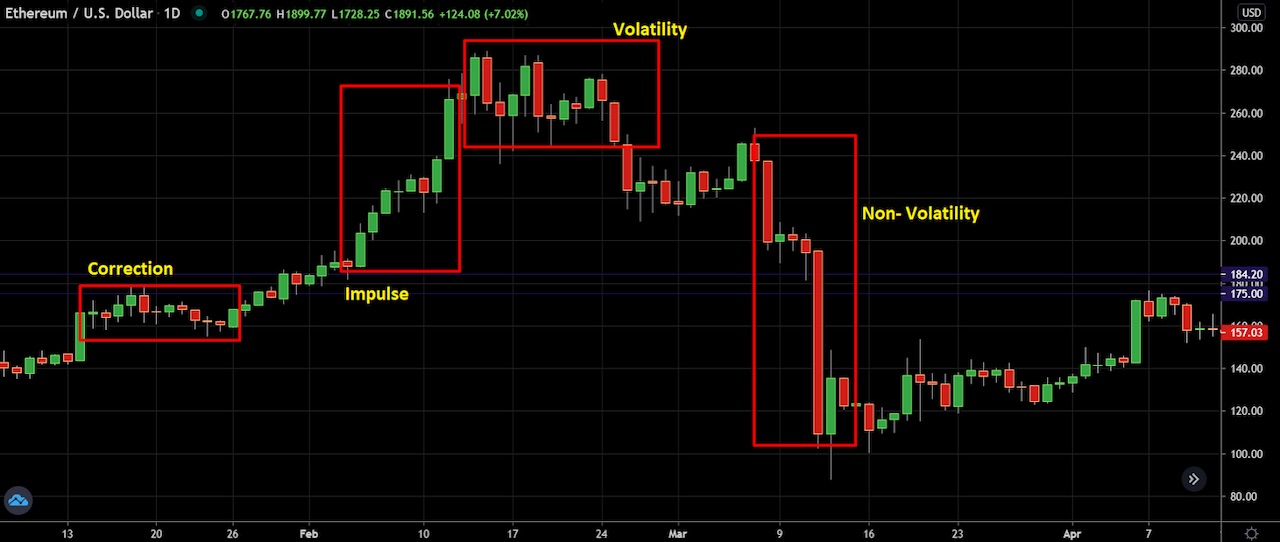
Bollinger Bands consist of a middle band (which is a moving average) and two outer bands that represent standard deviations from the moving average. The width of the bands reflects market volatility. When the bands are narrow, it indicates low volatility, while wider bands suggest higher volatility.
Traders on Bybit use Bollinger Bands to spot potential breakouts or reversals. If the price moves close to the upper band, the market may be overbought, while touching the lower band could suggest the market is oversold. This information can guide traders in determining whether to enter or exit positions.

Fundamental Analysis
While technical analysis is focused on price movements and patterns, fundamental analysis looks at the broader economic and financial factors that influence an asset’s value. In the case of derivatives trading on Bybit, fundamental analysis provides traders with insight into the underlying forces driving the market, such as regulatory developments, market demand, supply dynamics, and macroeconomic factors.
Regulatory Developments
In the cryptocurrency space, regulatory news can have a significant impact on the market. For example, announcements from governments or financial authorities regarding cryptocurrency regulations or the legal status of certain assets can cause sharp price movements in the derivatives markets.
Bybit offers traders the ability to track relevant news and regulatory developments directly from its platform, allowing traders to adjust their strategies accordingly. For instance, the launch of a Bitcoin ETF could increase institutional demand, positively affecting the price of Bitcoin and other related derivatives. Conversely, negative regulatory news, such as a ban on cryptocurrency trading in a major market, could cause prices to fall.
Market Demand and Supply
Fundamental analysis also involves evaluating the basic laws of supply and demand, which are crucial for understanding the value of a particular asset. For example, if demand for Bitcoin increases due to institutional adoption or macroeconomic instability, traders may anticipate a price increase. Conversely, if supply outstrips demand, such as when miners sell large amounts of Bitcoin or when demand wanes due to unfavorable market conditions, prices may fall.
On Bybit, traders can monitor supply and demand dynamics by tracking market orders, open interest, and volume. High open interest can indicate that more traders are involved in a market, suggesting stronger demand for the asset.
Macroeconomic Events
Macroeconomic events like changes in interest rates, inflation data, or major global events can significantly affect cryptocurrency prices. Bybit traders often pay attention to these events, as they can impact investor sentiment and lead to sharp price movements. For instance, if central banks announce interest rate cuts, it could increase demand for cryptocurrencies as an alternative asset class.
Incorporating macroeconomic data into trading strategies on Bybit is crucial for staying ahead of price trends and making informed decisions. Many advanced traders also use external news aggregation services that integrate directly with Bybit, ensuring they are always aware of key events that could impact their positions.

Market Sentiment Indicators
Market sentiment refers to the overall mood or tone of the market, which can be bullish, bearish, or neutral. Sentiment plays a pivotal role in driving price movements, especially in volatile markets like cryptocurrencies. Bybit provides traders with sentiment indicators that help measure the prevailing market sentiment.
Fear and Greed Index
The Fear and Greed Index is one of the most widely used sentiment indicators in cryptocurrency markets. This index measures the emotional state of the market by analyzing factors such as volatility, social media activity, and market momentum. A high level of greed in the market suggests that prices may be overextended, while a high level of fear indicates that market participants are overly pessimistic, which could present a buying opportunity. Bybit traders can use this index to get an overall sense of market mood and make trading decisions based on whether sentiment is skewed too far in one direction.
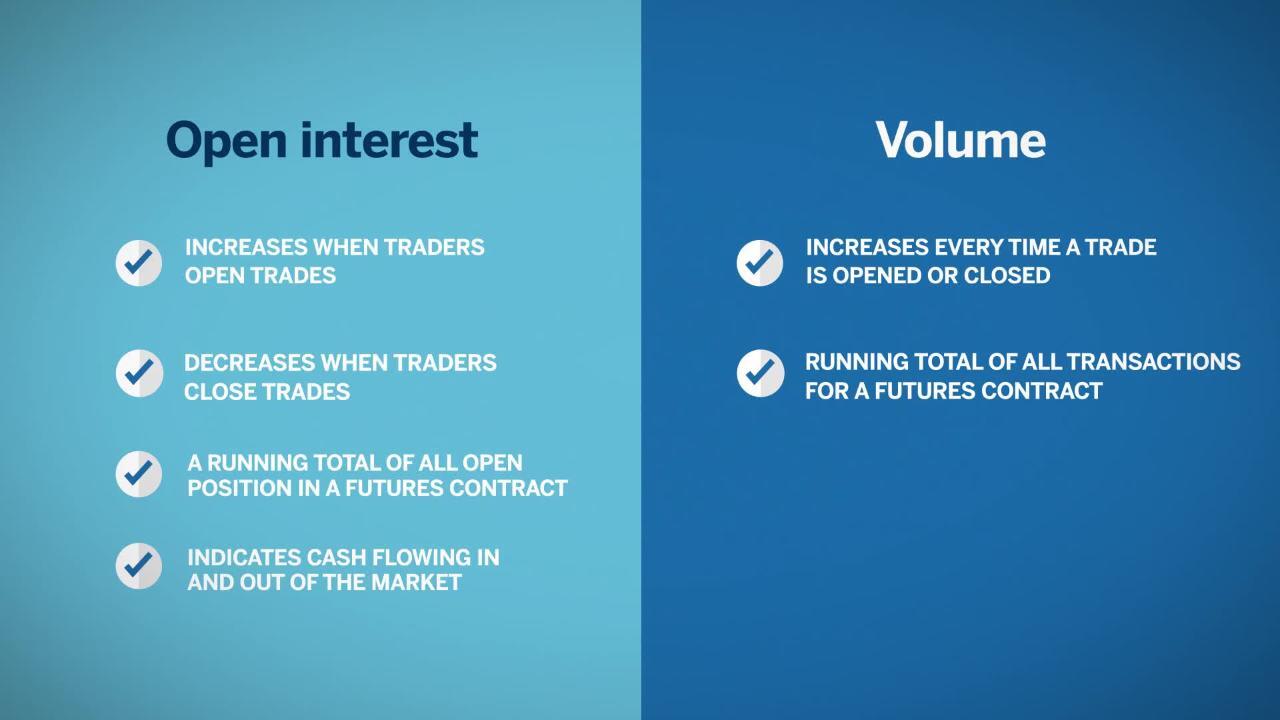
Open Interest
Open interest refers to the total number of outstanding contracts (both long and short) in the market. It is often used as a sentiment indicator, as an increase in open interest suggests that more traders are participating in the market, which could signal a continuation of the current trend.
Bybit provides real-time data on open interest for derivatives trading, helping traders understand whether the market is getting more crowded and whether a trend may be sustained or reversed. High open interest alongside a rising price may indicate that the bullish sentiment is strong, while a drop in open interest could signal that traders are exiting their positions.
Social Media and News Sentiment
Social media platforms like Twitter, Reddit, and Telegram have a significant impact on market sentiment, especially in the cryptocurrency space. Bybit traders can track social media trends to gauge how the broader community is feeling about certain assets. Positive news about a cryptocurrency or bullish social media discussions can lead to a surge in market sentiment, while negative news can trigger sell-offs.
Market analysis is at the core of successful derivatives trading on Bybit. By leveraging a combination of technical analysis tools, fundamental analysis, and market sentiment indicators, traders can make more informed and effective decisions, managing their positions and risks more efficiently.
In 2025, Bybit will continue to offer cutting-edge tools and features that empower traders to analyze the markets in-depth. Whether you are a beginner just starting your journey or an experienced trader looking to refine your strategy, Bybit provides everything you need to stay ahead of market trends and maximize your trading potential. By combining all these methods of analysis, traders can increase their chances of success in the fast-paced world of cryptocurrency derivatives trading.