
Imagine you’re a pirate sailing the high seas of the financial markets. You don’t just rely on gut instinct—you need a treasure map. And that’s exactly what candlestick patterns are! These little sticks of wisdom can tell you when to hoist the sails and go all in or when to abandon ship before the market storms hit. Whether you’re trading Bitcoin, stocks, or forex, knowing how to read candlestick charts is like having a secret weapon in your trading arsenal.
What Are Candlestick Patterns?
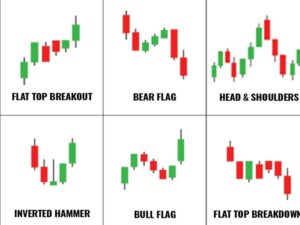
Candlestick patterns are a crucial tool for traders analyzing price movements in financial markets. They provide insights into market sentiment and help investors make informed decisions. Whether you’re trading stocks, forex, or cryptocurrencies, understanding candlesticks can improve your ability to predict price movements.
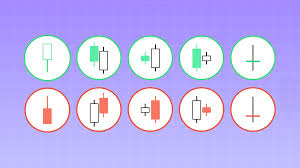
A candlestick consists of four key data points:
- Open price – The price at which the asset started trading during the period.
- Close price – The price at which the asset ended trading.
- High price – The highest price reached during the period.
- Low price – The lowest price recorded during the period.
Traders use these elements to recognize different candlesticks, helping them decide when to enter or exit a trade.
Why Are Candlestick Patterns Important?
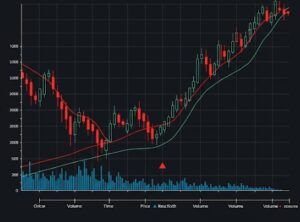
Market trends are driven by investor psychology, and candlestick patterns provide a visual representation of this behavior. They can signal potential reversals, trend continuations, or market indecision, which are valuable insights for traders. By mastering these patterns, investors can anticipate future price movements more effectively.
Common Candlestick Patterns Every Trader Should Know
Understanding candlestick patterns is like learning a new language—the language of the markets. These patterns tell a story about price action, giving traders insight into market sentiment and potential future movements. Whether you’re a day trader, swing trader, or long-term investor, recognizing these formations can be a game-changer. Below, we explore the most significant bullish and bearish candlestick patterns every trader should know.
Bullish Candlestick Patterns
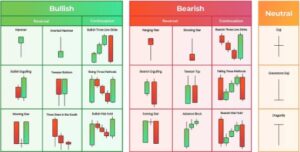
Bullish candlestick patterns indicate potential upward price movement. They appear after a downtrend and suggest a possible trend reversal. Some essential bullish candlestick patterns include:
- Bullish Engulfing – A larger green candle completely engulfs the previous red candle, signaling strong buying pressure.
- Hammer (Candlestick Chart Hammer) – A small body with a long lower wick indicates that buyers are stepping in after a sharp decline.
- Morning Star – A three-candle pattern showing a transition from bearish to bullish sentiment.
- Three White Soldiers – Three consecutive long green candles confirm strong buying momentum.
Bearish Candlestick Patterns

Bearish candlestick patterns indicate a potential market downturn. They help traders recognize when to exit a position or short an asset. Common bearish patterns include:
- Bearish Engulfing – A large red candle engulfs the previous green candle, signaling strong selling pressure.
- Shooting Star – A candle with a small body and a long upper wick indicates a potential reversal from an uptrend.
- Evening Star – A three-candle formation signaling a bearish reversal after an uptrend.
- Three Black Crows – Three consecutive long red candles confirm strong selling momentum.
Using Candlestick Indicators for Trading Decisions

Candlestick indicators are technical analysis tools that enhance trading strategies. These indicators help confirm signals from candlestick patterns, reducing the chances of false predictions. Some of the most effective candlestick indicators include:
- Moving Averages – Used to smooth out price data and confirm trends.
- Relative Strength Index (RSI) – Measures the strength of price movements and identifies overbought or oversold conditions.
- Bollinger Bands – Shows volatility levels and helps traders recognize price breakouts.
- Volume Analysis – Confirms price movement strength and helps validate candlestick chart patterns.
How to Read a Candlestick Chart Effectively
Understanding a candlestick chart is essential for every trader. Here’s a step-by-step guide to analyzing candlestick formations:
- Identify the trend – Look for an overall upward or downward movement in the chart.
- Spot key candlestick patterns – Recognize bullish or bearish formations.
- Confirm with indicators – Use moving averages, RSI, or volume analysis to strengthen your predictions.
- Check support and resistance levels – These are price levels where trends often reverse or continue.
- Plan your trade – Decide entry and exit points based on the identified patterns and indicators.
Combining Candlestick Patterns with Limit Orders
When trading, using what is a limit order in combination with candlestick patterns can enhance your strategy. Limit orders allow traders to set predefined buy or sell prices, ensuring they enter or exit a trade at optimal levels. This strategy helps minimize risk and maximize returns, especially when trading volatile assets like cryptocurrencies.
For instance, if a bullish candlestick appears near a support level, traders can place a limit order slightly above the confirmation price to catch the uptrend. Conversely, when a bearish candlestick forms near resistance, traders can set a limit order below to short the asset efficiently.
Common Mistakes When Trading with Candlestick Patterns
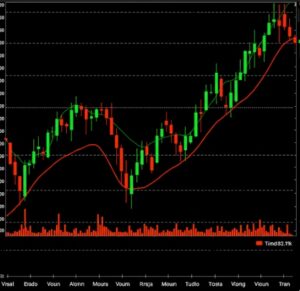
Even experienced traders can make mistakes when interpreting candlestick patterns. Here are some common errors to avoid:
- Ignoring volume confirmation – Always check if price movement is supported by trading volume.
- Overtrading based on patterns alone – Combine patterns with technical indicators for better accuracy.
- Misidentifying patterns – Some formations may look similar but have different meanings.
- Failing to set stop-loss orders – Always have risk management strategies in place.
Conclusion
Mastering Candlestick Patterns for Better Trading. Understanding candlestick patterns is essential for any trader looking to make informed investment decisions. These patterns provide valuable insights into market sentiment and potential price movements, helping investors refine their strategies.
By combining candlestick indicators, technical analysis tools, and trading strategies like what is a limit order, traders can significantly improve their success rate. Remember, mastering candlestick takes time and practice, so always back-test your strategies and stay informed.


