
In the ever-evolving world of cryptocurrency, investors and traders constantly seek ways to decode market movements and predict future trends. One of the most effective tools in a trader’s arsenal is the study of crypto chart patterns. These patterns provide a visual framework that helps in identifying potential buy or sell signals, thus enabling more informed decision-making. This guide will take you on a comprehensive journey through the various aspects of crypto chart patterns, explaining their importance, types, and how they can be used in tandem with other technical indicators to develop a robust trading strategy.
Introduction to Crypto Chart Patterns
Crypto chart patterns are graphical representations found on crypto price charts that illustrate the historical price movements of digital assets. By studying these patterns, traders can predict potential future movements, making them indispensable for technical analysis. Whether you are a seasoned investor or a newcomer to the cryptocurrency market, understanding crypto chart patterns is crucial for navigating the volatile world of digital currencies.
Historically, chart patterns have been widely used in traditional stock markets, and their application has seamlessly extended to the crypto realm. The concept revolves around the idea that history tends to repeat itself. As more data is accumulated and more patterns emerge, the significance of these patterns grows stronger, guiding investors on when to enter or exit trades.
In this guide, we will not only explore various crypto chart patterns but also delve into related concepts such as crypto candlestick patterns and crypto trading patterns. These terms are often used interchangeably, but each has its unique features and implications.
Key Crypto Chart Patterns in the Market
There is a vast array of crypto chart patterns that investors can study. Some of the most popular patterns include:
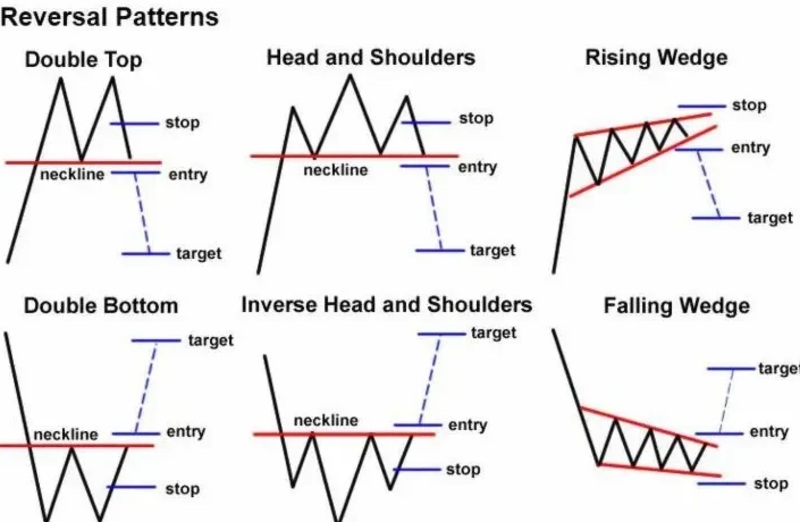
Head and Shoulders
The head and shoulders pattern is one of the most well-known reversal patterns. It signals a potential trend reversal from bullish to bearish. This pattern consists of a peak (shoulder), followed by a higher peak (head), and then another lower peak (shoulder). Recognizing this pattern early on can provide timely signals to exit long positions or initiate short positions.
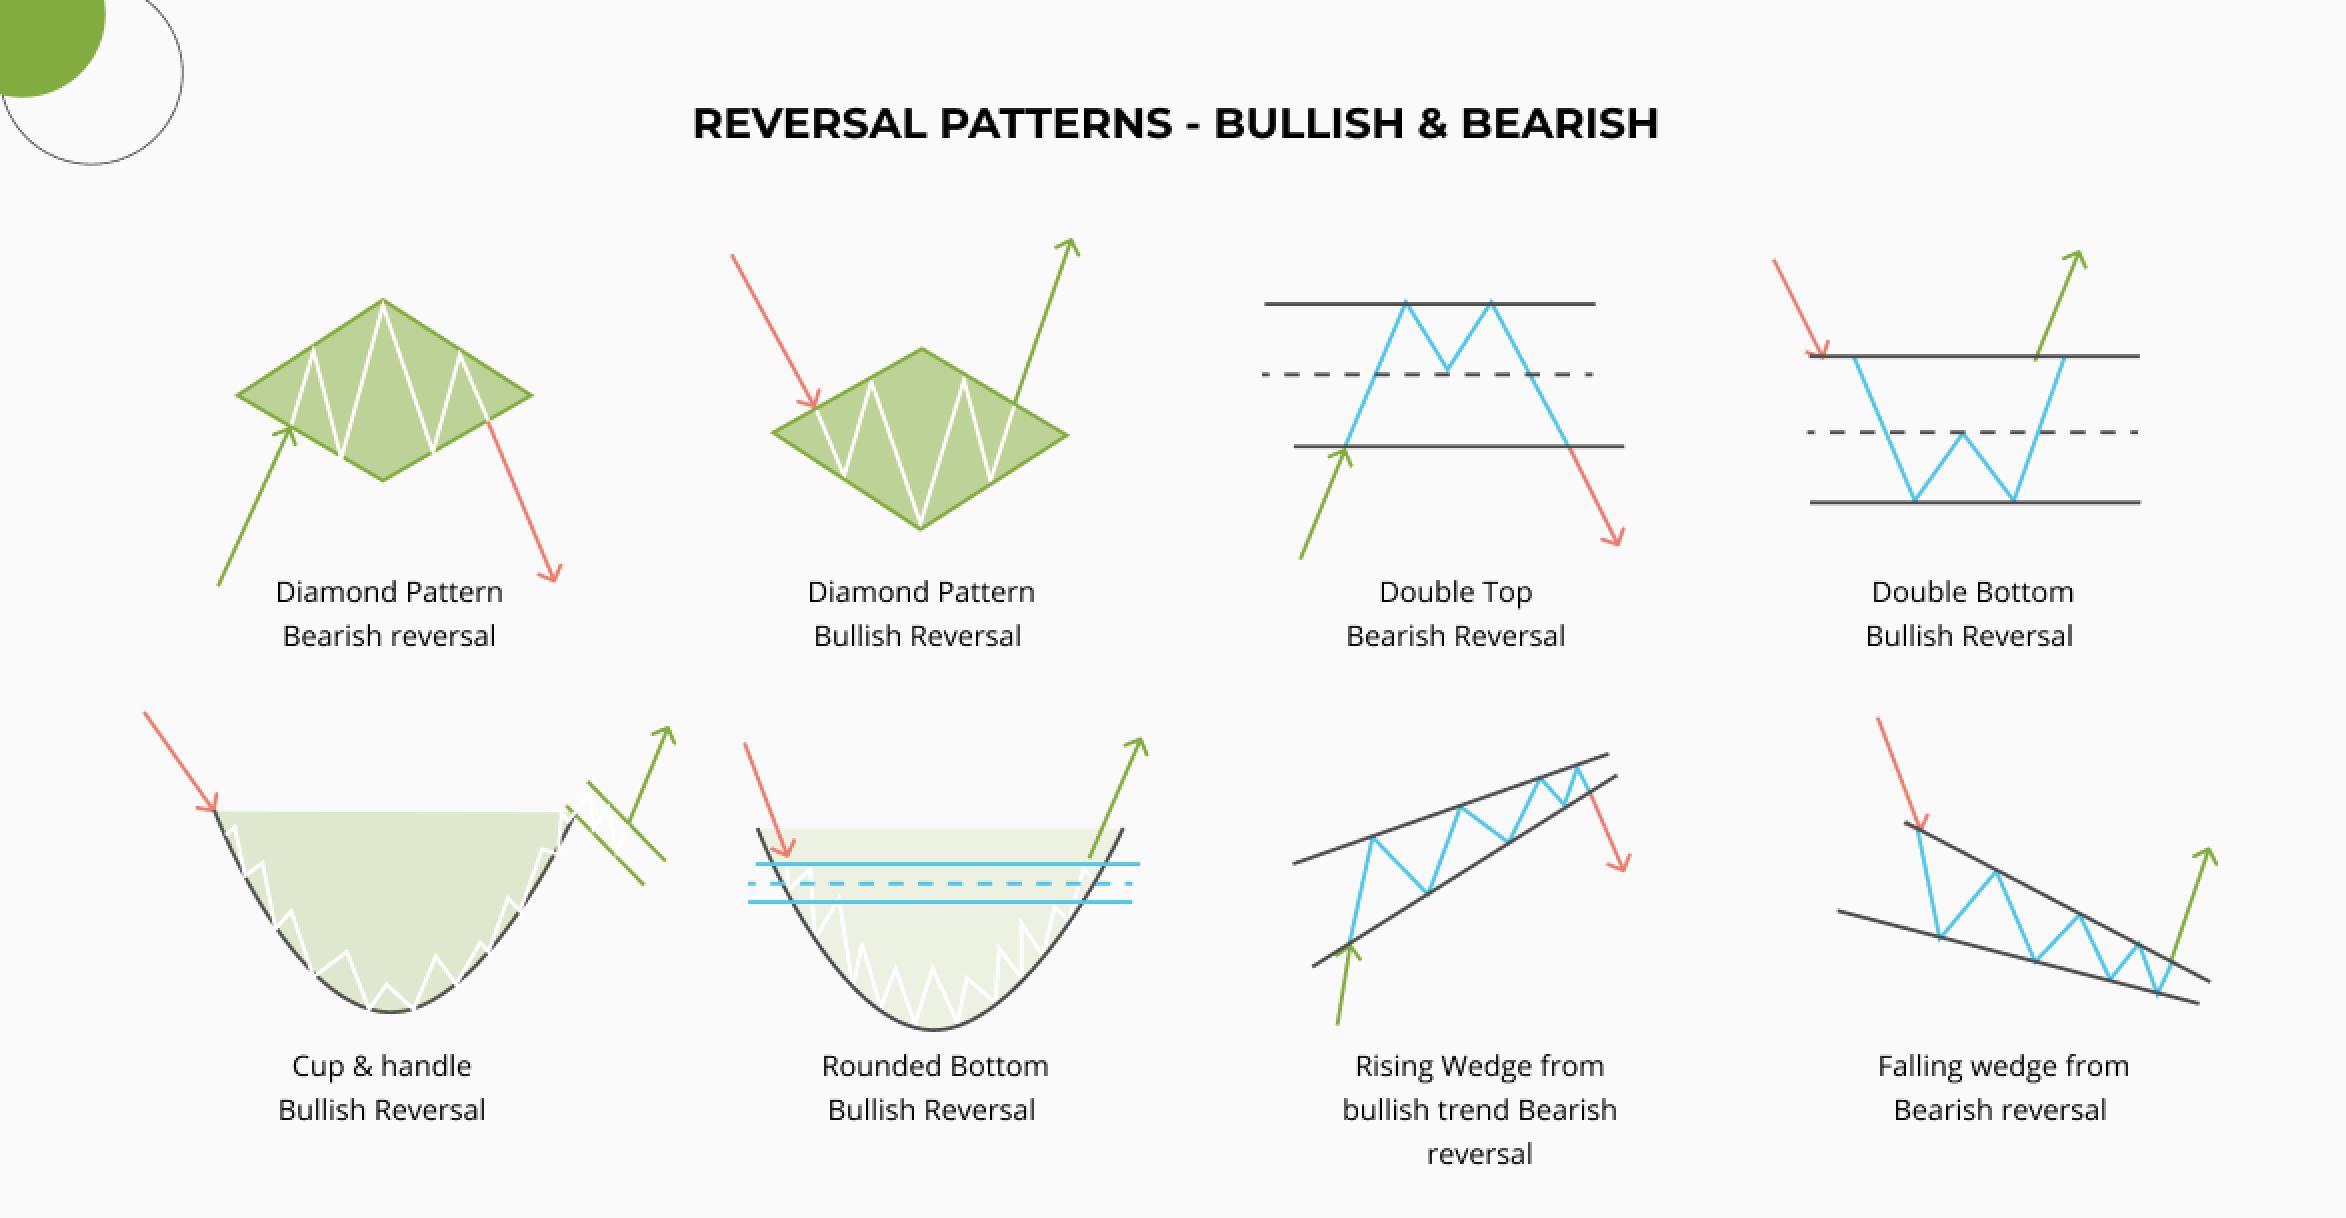
Double Top and Double Bottom
These patterns are formed by two consecutive peaks or troughs. A double top indicates a bearish reversal, while a double bottom signals a bullish reversal. Traders who identify these patterns can anticipate significant shifts in market sentiment.
Triangles: Ascending, Descending, and Symmetrical
Triangles are continuation patterns that indicate consolidation before the next significant move. An ascending triangle is typically bullish, whereas a descending triangle is bearish. A symmetrical triangle suggests indecision, often preceding a breakout in either direction. These patterns are closely monitored by technical analysts to gauge market momentum.
Flags and Pennants
Flags and pennants represent short-term consolidation periods following a strong price movement. Once the consolidation ends, the price is likely to continue in the direction of the previous trend. These patterns are particularly useful for intraday traders looking to capture quick profits.
Throughout this discussion, it’s important to remember that crypto chart patterns offer a historical perspective that can help forecast future price movements. However, they should always be used in conjunction with other indicators to confirm signals and manage risk effectively.
Understanding Crypto Price Charts and Candlestick Patterns
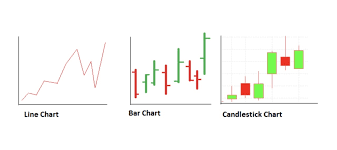
A deep dive into crypto chart patterns wouldn’t be complete without discussing crypto candlestick patterns. These are a specific type of chart used by many traders due to their visual appeal and the depth of information they convey. Candlestick charts provide insights into the open, high, low, and close prices within a specific time frame, offering clues about market sentiment.
The Anatomy of a Candlestick
A candlestick is composed of a body and wicks (or shadows). The body represents the range between the opening and closing prices, while the wicks show the highest and lowest prices reached during that period. The color of the body can indicate market direction: a bullish candle (often green) indicates upward movement, and a bearish candle (often red) indicates downward movement.
Popular Crypto Candlestick Patterns
Several crypto candlestick patterns are essential for traders:
- Doji: Represents market indecision and is often a precursor to a reversal.
- Hammer and Hanging Man: These patterns can signal potential reversals depending on the context in which they appear.
- Engulfing Patterns: A bullish or bearish engulfing pattern provides a strong signal of a potential reversal in market trends.
Integrating crypto candlestick patterns into your study of crypto chart patterns can provide a more nuanced view of market behavior, helping to refine entry and exit strategies.
Utilizing Crypto Trading Patterns for Informed Investments
Beyond the identification of traditional chart patterns, it is essential to understand crypto trading patterns that emerge from market sentiment and volume dynamics. These patterns help in determining the strength of a trend and the likelihood of a reversal.
Volume Analysis and Market Sentiment
Volume plays a crucial role in validating crypto chart patterns. A breakout from a pattern is more significant if accompanied by a surge in volume. This increase in volume confirms that there is genuine market interest behind the move. Without this confirmation, the breakout might be a false signal, leading to potential losses.
Combining Patterns with Technical Indicators
To maximize the effectiveness of crypto chart patterns, traders often combine them with other technical indicators like:
- Moving Averages: These help smooth out price data and confirm the trend direction.
- Relative Strength Index (RSI): Indicates whether an asset is overbought or oversold.
- MACD (Moving Average Convergence Divergence): Provides insights into the momentum and potential trend reversals.
By combining these tools, investors can gain a comprehensive view of the market, ensuring that their strategies are well-rounded and informed.
Read more related articles-> here
Advanced Techniques in Analyzing Crypto Chart Patterns
For advanced traders, analyzing crypto chart patterns goes beyond merely identifying shapes on a chart. It involves understanding the underlying market psychology and macroeconomic factors that drive price movements.
Pattern Reliability and Confirmation
Not all crypto chart patterns yield accurate predictions every time. It is crucial to seek confirmation through multiple indicators. For instance, a bullish head and shoulders pattern might be more reliable if it coincides with a bullish divergence in the RSI. This multi-indicator approach reduces the risk of acting on false signals.
Time Frames and Pattern Efficacy
The efficacy of crypto chart patterns can vary significantly depending on the time frame. Short-term patterns on hourly charts may offer quick profits but come with higher risk. On the other hand, daily or weekly patterns tend to be more reliable for long-term investments. Traders should choose the time frame that best aligns with their trading style and risk tolerance.
The Role of Market Psychology
Market psychology is at the heart of every crypto chart pattern. Investor emotions such as fear, greed, and panic often manifest as identifiable patterns on a chart. By understanding these psychological factors, traders can better anticipate market moves and adapt their strategies accordingly.
Risks and Limitations of Crypto Chart Patterns
While crypto chart patterns can be powerful tools, they are not without limitations. It is essential to be aware of potential pitfalls and adopt a cautious approach.
False Breakouts and Pattern Failure
One of the main challenges with crypto chart patterns is the occurrence of false breakouts—where the price appears to break through a pattern’s resistance or support level, only to reverse direction. This can lead to significant losses if not managed properly. Implementing stop-loss orders and confirming signals with additional indicators can help mitigate these risks.
Market Volatility
The cryptocurrency market is notoriously volatile. While crypto chart patterns provide a structured approach to analyzing price movements, the unpredictable nature of the market means that even the most reliable patterns can fail during periods of extreme volatility. Traders must always remain vigilant and adaptable, understanding that no tool is foolproof.
Dependence on Historical Data
Crypto chart patterns rely heavily on historical data, which may not always predict future performance accurately. Sudden shifts in market dynamics, regulatory changes, or macroeconomic events can render historical patterns less effective. As such, it is crucial to use chart patterns as one of several tools in your analytical toolkit rather than relying on them exclusively.
Practical Application: Developing a Trading Strategy with Crypto Chart Patterns
To effectively use crypto chart patterns in your trading strategy, you need to develop a systematic approach that incorporates both technical analysis and risk management.
Step 1: Identify the Pattern
Begin by analyzing crypto price charts to identify recognizable patterns. Look for formations like head and shoulders, double tops, triangles, and flags. Use drawing tools on your trading platform to mark the pattern boundaries and key support/resistance levels.
Step 2: Confirm with Volume and Indicators
Once you’ve identified a potential pattern, confirm its validity with volume analysis and additional technical indicators like RSI, MACD, or moving averages. This confirmation step is critical to avoid false signals.
Step 3: Plan Your Trade
Develop a detailed trading plan that outlines your entry, exit, and stop-loss levels. For example, if you are trading a breakout from an ascending triangle, determine your entry point above the resistance level and set a stop-loss just below the support line. This disciplined approach helps in managing risk effectively.
Step 4: Monitor and Adapt
After placing your trade, continuously monitor the market for any signs of reversal or changes in volatility. The dynamic nature of the cryptocurrency market means that crypto trading patterns can evolve rapidly. Stay informed and be prepared to adapt your strategy as new information emerges.
By following these steps, you can harness the power of crypto chart patterns to improve your trading outcomes and make more confident investment decisions.
Conclusion
Mastering Crypto Chart Patterns for Successful Trading. In summary, understanding crypto chart patterns is essential for any investor looking to succeed in the competitive world of cryptocurrency trading. From the basics of chart interpretation to the integration of technical indicators and risk management strategies, this guide has covered a broad spectrum of tools and techniques that can enhance your trading approach.