In the fast-paced world of finance and cryptocurrency, many investors frequently ask, “What is all time high?“ This term, which has gained significant traction over recent years, is not only a benchmark for market performance but also a signal that guides investor sentiment and trading strategies. In this guide, we will delve into the meaning, importance, and implications of reaching an all time high, all while examining how candlestick patterns can provide additional insights into market dynamics.
What is All Time High: Definition and Importance

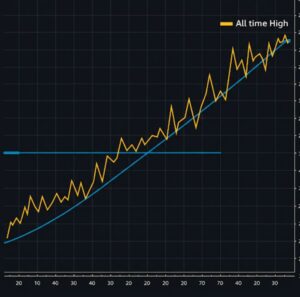
The term “What is all time high” is used to denote the highest price level or value that an asset—such as stocks, cryptocurrencies, or commodities—has ever reached in its trading history. When a market asset hits its all time high, it often becomes a focal point for both media coverage and investor analysis. This milestone is not only a mark of historical achievement but also serves as a psychological barrier, influencing investor behavior and market sentiment.
Reaching an all time high can indicate several things:
- Investor Confidence: It signals robust investor interest and confidence in the asset’s future prospects.
- Market Momentum: It may point to an upward trend that attracts further investment, creating a self-reinforcing cycle.
- Technical Benchmark: For technical analysts, an all time high is a critical level for chart analysis and can indicate potential resistance or support levels.
Understanding what is all time high is essential for making informed decisions in both traditional and digital asset markets. It acts as a reference point, allowing traders to compare current performance against historical benchmarks and assess whether the market is poised for further gains or a potential correction.
What is All Time High: A Closer Look at Market Milestones

Historically, asset prices that reach an all time high have captured the attention of investors and analysts alike. When a stock or cryptocurrency records its highest ever price, it often leads to a surge in trading volume and media interest. But what is all time high beyond the number on a chart? It’s a milestone that represents the peak of market optimism and, in many cases, reflects underlying fundamentals such as strong earnings, positive news, or innovative technology developments.
Market milestones like these are crucial for several reasons:
- Validation of Market Trends: They confirm that the asset has overcome previous resistance levels.
- Attraction of New Investors: Record highs can attract new market participants who wish to ride the wave of optimism.
- Catalyst for Technical Analysis: Analysts often look to all time high levels when setting targets for future price movements and determining exit strategies.
For instance, during the cryptocurrency boom, several digital assets reached all time high values, spurring discussions about the sustainability of these levels and the possibility of a market bubble. Investors had to constantly ask themselves, “What is all time high” in the context of market behavior, and whether these peaks were driven by solid fundamentals or merely speculative frenzy.
Understanding Candlestick Patterns in the Context of What is All Time High

While the concept of what is all time high provides a historical snapshot of asset performance, candlestick patterns offer a more nuanced view of market sentiment. Candlestick patterns are graphical representations used in technical analysis to forecast short-term price movements. They help investors understand market psychology by indicating potential reversals or continuations in trends.
In the context of an all time high, candlestick patterns can be particularly insightful. For example:
- Bullish Engulfing Pattern: This pattern may confirm the strength behind an asset breaking through its all time high, suggesting further upward momentum.
- Doji Candlesticks: The appearance of doji patterns near all time high levels might indicate market indecision and a potential reversal.
Although candlestick patterns are used less frequently than the overall concept of what is all time high, they play an important role in the technical analysis toolkit by providing visual cues that complement broader market trends. The interplay between record-high prices and candlestick formations can help seasoned traders refine their entry and exit strategies, ensuring a balanced approach to risk management.
Technical Analysis: Indicators and What is All Time High

Technical analysis is an indispensable tool for investors looking to decipher market trends. When asking “What is all time high?”, it’s important to consider a variety of technical indicators that support the analysis of price action. These include moving averages, trend lines, and momentum indicators such as the Relative Strength Index (RSI).
Key Technical Indicators:
- Moving Averages: Often used to smooth out price data, moving averages can help identify the overall trend direction and confirm whether a new all time high is likely to sustain.
- Volume Analysis: A surge in trading volume accompanying an all time high often validates the strength of the breakout.
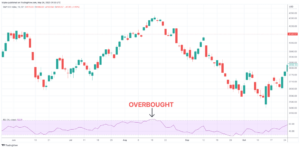
- RSI and MACD: These momentum indicators help signal whether an asset is overbought or oversold, providing context on whether the all time high is a temporary spike or part of a longer-term trend.
By integrating these technical tools with the concept of what is all time high, investors can better determine if a market is poised for continued growth or if a correction is imminent. It is the combination of historical data and real-time analysis that allows for a well-rounded understanding of market behavior.
Investor Perspectives: What is All Time High and Its Impact on Trading Strategies

From the viewpoint of an investor, reaching an all-time high is both a cause for celebration and caution. When asset prices hit their highest levels, the enthusiasm can drive more capital into the market. However, it is crucial to remain vigilant and critically assess the underlying factors that contributed to this peak.
Considerations for Investors:
- Profit Taking: Investors may choose to secure gains by selling part of their holdings when an asset reaches an all time high.
- Market Sentiment Shifts: A record high can alter market sentiment dramatically, sometimes leading to over-exuberance followed by a sharp correction.
- Risk Management: Understanding what is all time high can help in setting stop-loss orders and establishing realistic profit targets.
Investors who recognize the importance of all time high levels typically adopt a balanced approach that blends technical analysis with fundamental insights. By asking “What is all time high?” at critical junctures, they can gauge whether market enthusiasm is justified or if caution should prevail. For those who combine these insights with disciplined risk management practices, the potential for long-term success is significantly enhanced.
Risk Management and What is All Time High in Portfolio Management

Risk management is at the heart of any successful investment strategy, especially when dealing with assets that are experiencing record highs. When determining what is all time high, investors need to consider the potential risks associated with holding an asset at its peak price.
Strategies for Managing Risk:
- Diversification: One of the primary ways to mitigate risk is by diversifying your portfolio. Relying solely on an asset that has reached its all time high can expose you to significant market volatility.
- Stop-Loss Orders: Implementing stop-loss orders can help protect gains and limit potential losses if the market reverses after hitting an all time high.
- Regular Portfolio Reviews: By continuously monitoring your investments and reassessing your risk tolerance, you can better manage the impact of market fluctuations.
The decision-making process should always include the question, “What is all time high?” as part of a broader risk assessment framework. Investors who pay close attention to these key levels are better equipped to navigate the complexities of market cycles, ensuring that they are not caught off guard by sudden reversals or unexpected downturns.
Future Trends: Predicting the Next All Time High
Predicting the next all time high is a challenging yet enticing prospect for many investors. While historical data and technical analysis provide valuable insights, the dynamic nature of markets means that forecasting future highs involves a significant degree of uncertainty.
Factors That Influence Future Highs:
- Economic Indicators: Macroeconomic trends, such as inflation rates, employment figures, and GDP growth, can have a profound impact on market performance.
- Technological Innovations: Breakthroughs in technology, especially in sectors like blockchain and artificial intelligence, can drive asset prices to new heights.
- Global Events: Political and economic events on a global scale often create volatility, influencing whether an asset will reach a new all time high or not.
The question “What is all time high?” is not static; it evolves as markets progress and new data emerges. Investors must remain agile, constantly updating their models and adjusting their strategies to align with the latest market realities.
What is All Time High and Its Impact on Your Investment Strategy

In summary, understanding what is all time high is pivotal for both new and seasoned investors. This concept serves as a crucial marker of market performance, influencing everything from technical analysis to investor sentiment and risk management. By integrating insights from candlestick patterns and other technical indicators, traders can develop a more robust understanding of market trends and make more informed decisions.
For investors who have experienced the thrill of seeing their assets reach an all time high, it’s important to remember that such milestones, while promising, also necessitate a disciplined approach to trading and portfolio management. Maintaining a balance between optimism and caution is essential for long-term success. Every time you ask “What is all time high?” you’re not just seeking a number; you’re evaluating the culmination of market momentum, investor psychology, and a host of economic factors that together drive the market forward.
As you continue to refine your investment strategies, always consider how all time high levels influence market behavior and how tools like candlestick patterns can offer deeper insights into price movements. Whether you’re a day trader or a long-term investor, keeping an eye on these record benchmarks can provide valuable guidance on when to buy, hold, or sell.
For more comprehensive guides and up-to-date analysis on market trends, technical analysis, and investment strategies. This platform not only offers detailed market insights but also helps investors stay informed about the latest trends and tools in the rapidly evolving world of finance and cryptocurrency.
Ultimately, what is all time high remains a powerful indicator of market sentiment and an essential element in the toolkit of any serious investor. By understanding its significance and integrating it into your overall strategy, you position yourself to better navigate market cycles and capitalize on future opportunities. Stay informed, remain disciplined, and let the lessons from historical highs guide your future investments.
This comprehensive guide has addressed the key question: What is all time high? By exploring its definition, historical significance, and impact on both technical analysis and risk management, we have provided a robust framework to help you understand and leverage market milestones. Remember, every new all time high represents not just a moment in time, but a reflection of market confidence and a potential turning point for future trends. Use these insights to refine your trading strategy, always keeping in mind the importance of diversification, disciplined risk management, and continuous market education.
As we wrap up, consider this guide a resource for your ongoing investment journey. By regularly revisiting concepts like what is all time high and studying how candlestick patterns interplay with market trends, you can develop a more nuanced perspective that will serve you well in any market condition. Explore more articles, tutorials, and in-depth analyses at coinzeus.io—your go-to source for investor education and market insights.
Conclusion
In the ever-evolving landscape of trading, asking what is all time high is more than just a query—it’s an invitation to explore the complexities of market behavior and to harness the tools that can lead to smarter, more informed investment decisions.


